Read more: |

Matti Grönroos
The Highest Quality Target Usually Is Not the Optimum
Quite often, the customer insists on targeting for 90 % success for the Incident Management.
90 %, OK. But 90 % of what?
Usually, Incident Management is measured by a statistical indicator like "X per cent of all incidents shall be resolved within Y hours". The vendor knows very well the dynamics of those figures. When X grows, then Y must grow, too. And this has implications.
The most common metric of the Incident Management, Time to Resolve, is almost always gamma distributed: Most incidents are resolved quickly, but the challenging tickets may spend a long time in the process. That is why the target is statistical: It is agreed that agreed percentage of incidents shall be solved within agreed deadline. The percentage is usually drawn from a sleeve, and the deadline is guessed after some experimenting. As time passes, the guess will be gradually refined into a binding target, and failures to meet it will lead to punishment.
A chart tells us more:
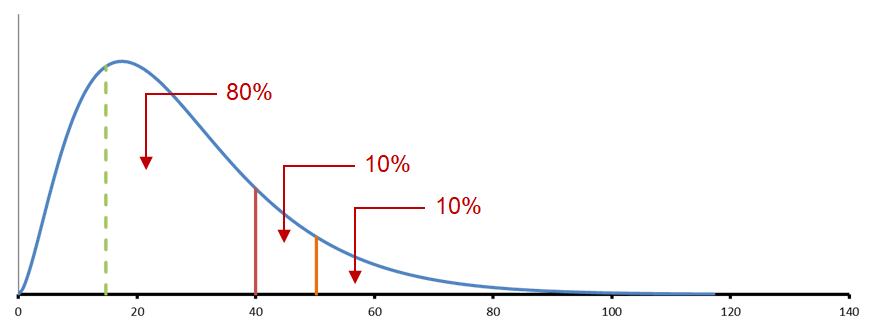
The blue curve shows the distribution of time-to-resolve. What is essential is the area under the curve, which indicates the number of cases. In our example, 80 % of the incidents are resolved within 40 hours (the red vertical line). The average time is not at the halfway between 0 and 40 but shorter: about 15 hours (the green dashed line).
If the time-to-resolve target were 90 % instead of 80 %, the deadline would have been extended to about 50 hours (amber line). The figures depend on each other. Even in this case, 10 % of incidents remain open.
If the deadline had to remain in 40 hours, more resources are needed to do more work, and the increase of the cost is unavoidable.
For the service providers, the most critical indicator is often the deadline. If the deadline of our example is extended from 40 hours to 50, that is likely to have an impact to all incident tickets, not only to those ones between 80 and 90 per cent. The average resolution time tends to increase, because the service provider staff has got a clue that these tickets are not as urgent as thought earlier.
Summa summarum: A good-looking improvement in target setting may lead to a worse outcome. There are good reasons to think carefully about the dynamics of target setting.
A more important thing than percentages and deadlines is how to cope with tickets exceeding the deadline. If there is no incentive to resolve them, the service provider might see them as lost cases, and more or less ignores them. The logical next step for such incidents would be Problem Management: The case is analyzed in a structured way, and reasonable next steps are agreed. The incident can be closed as unresolved, too. It is a reality that there is no business case to resolve every incident.
The procedure may also be simpler than Problem Management: Tickets exceeding the deadline are included in the standard agenda of regular Service Level Management review meetings. The participants agree on whether the Incident Management should continue or the ticket shall be closed.