Read more: |

Matti Grönroos
You Get What You Measure
Too many service level indicators easily lead to the loss of the big picture. As our top management loves figures and reports, we create a set of metrics where everything is measured numerically. Then we review and analyze them. Then we delude ourselves that this is the way to create a credible view of our service level.
Nobody has invented a single metric to describe the success of the IT service delivery. If there is single SLA metric only, the service provider will optimize the delivery in a way to show this metric always green. However, this is only partial optimization, and the tasks outside the scope of this single metric may receive too little focus. Sounds familiar?
Unbelievably often, IT service agreements are built in such a way that the entire complex production machinery is mirrored by a few numerical SLA metrics only. In addition, the agreements are followed blindly, only looking to see if the metrics are green or red.
It is evident that it is impossible (or unreasonable) to create a set of tens of metrics where every blink of red leads to sanctions.
Unbelievably often, the time-to-resolve metric of Incident Management is selected as the sole metric to create the big picture of the entire service. Why is this happening? Why not, because the ticketing application provider with such data. But if some month five tickets of 100 miss the deadline instead of typical three, is everything rotten?
If the SLA metric is subject to sanctions, the vendor will pay much attention to this metric, of course. If there are a few metrics only, there is a risk of being attacked by a watermelon SLA: The vendor suboptimizes the SLA metrics to be green, while the other tasks might receive less attention. The end-users express their dissatisfaction.
Counting averages only is dangerous, because such calculations tend to hide smaller but recurring service outages under the carpet. If there are 100 servers, and the average availability across them is the only interesting metric, even semi-major incidents may be omitted from the service reports. Even if the availability score were 99.50 % one single server might be down for a few minutes several times a day without ever appearing in the reports.
If swiping things under the carpet is not the desired way of working, there is a danger to begin making science by modeling the value chains. Usually, the first action in this exercise is to allocate the downtime to other service elements by drivers. The final result is often a monster: a complex and crazy model hard to maintain and understand. In addition, such models tend to be very sensitive to small changes to the drivers and other assumptions. That is why the sense, value, and relevance of such an effort can be questioned.
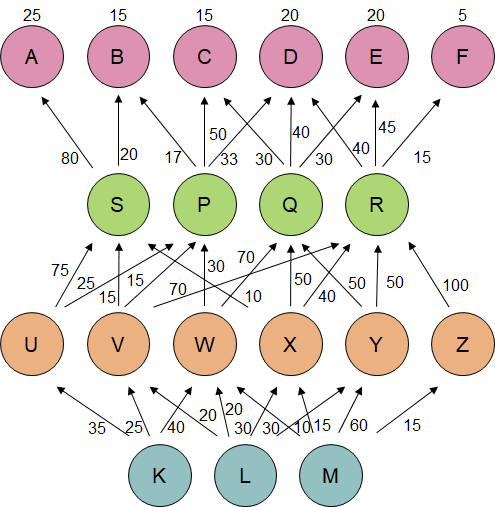
In this fictional sample model, the top row consists of the services A to F. Each of them has a weight factor for the SLA availability calculation. (The sum of weight factors is 100.)
The lower rows are the shared components on which the services are built. The driver figures express the share of the downtime (as a percentage) to be allocated to the next layer upwards.
If the downtime of K is 20 %, this is propagated to the services as following:
- A: 4.80 %
- B: 2.03 %
- C: 4.13 %
- D: 5,26 %
- E: 3.26 %
- F: 0.53 %
The weighted average is 3.85 &, thus making the total availability to be 96.15 %. It will remain unknown if the modeled result means something, if it is a good result, or if it is a bad result. The effort to create such a model and collect the data for it is not a trivial effort. Think about the case where you have 50 services and 200 components instead of 6 and 14.
If you see that Incident Management metrics are the vital for you, then you get very focused Incident Management. The remaining areas receive less attention. Every single service provider knows how to manipulate Incident Management metrics. If you focus on Incident Management only, you probably get manipulated Incident Management, and not much more. Happy now?